Best Practices for Navigating with 3D FLS
Example of 3D FLS targets as chart overlay.
Our navigation sonars have been designed for ease of operation on a variety of vessels, from small yachts to large commercial vessels. We've spent countless hours refining our user interface designs and improving the signal processing that enables our sonars to look ahead at navigationally significant ranges. Part of the power of our systems is that we don't force the user to conform to one particular mindset: users can operate with color mapped to depth or color mapped to signal strength; the 3D sonar display can be set to a top down orthographic projection or a rotatable 3D perspective; we offer a profile display which slices a vertical strip through the 3D data. The list goes on and on. Along the way, we try to make these displays natural and lead the user to their ideal configuration. We know that everyone visualizes the world around them differently and we continually solicit input from our users on how make our user interfaces work best for them. In this blog posting, we highlight some best practices that we recommend when using our software.
FarSounder's first product was a 3D forward looking sonar with 330 meters (1000') maximum range. We quickly released an improved model with maximum range out to 440 meters (1400'). However, both of these products started with a 3D sonar view as the only major display in the software. Soon afterward, we added a raster chart display tool which displayed BSB format charts. Today, our navigation products extend out to 1,000 meters range (1/2 nautical mile) and offer both a 3-dimensional sonar display as well as nautical charts with sonar overlay. Both of these displays have their uses and both can be quite valuable to the mariner when used correctly.
The 3D Sonar Display

The 3D Sonar Display set to display with 3D perspective in the main portion. Below is profile display where a 2D slice can be shown.
Perhaps the most obvious display for our products is the 3D Sonar Display. Every time the sonar pings, a new image is generated for the entire field of view. In this display, the sea floor is detected as a smoothed surface and in-water targets are displayed as a series of spheres representing the echo's voxel location.

The 3D Sonar Display can also be set to "standard" mode. This is a top down orthographic projection of the 3D sonar data.
FarSounder's bottom detection algorithms can generally map the seafloor to 8 water depths or more. This range is limited to the distance where the sonar's transmitted signal propagates to the target or bottom via direct propagation paths only, with no secondary surface or bottom bouncing (multipath). Though the algorithm is completely automated and does not require the user to set gain or thresholding levels, the range mode of the sonar can affect the quality of the bottom image. When set to Long Range Modes (500 or 1000 meters), our sonars automatically use a transmit signal that has been optimized for long range detections. When set to Short Range Modes (100 or 200 meters), our sonars automatically use a transmit signal optimized for short range target detection.

The SonaSoft workspace is split into the Main Workspace and the Sidebar Workspace. The user can drag the vertical divider to resize the two workspaces. Any sidebar window can also swap location with the main workspace.
For example, when operating in shallow water, the sea floor is very close to the sonar sensor. In this scenario, signals optimized for long range detection can create loud echoes from reflections off of very close targets (i.e. the short range bottom close to the sonar). These echoes can saturate the receiver system making the image of these short range targets less precise. If a vessel is operating in shallow water and maximum bottom precision is required, the user should set the sonar to one of the the Short Range Modes. This will, of course, limit the maximum range for the sonar, allowing the user to concentrate on the short range image.
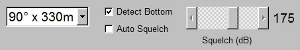
The software's Processor Controls select the various range modes and squelch levels.
Beyond the sonar's bottom mapping range, the sonar can still detect in-water targets at up to the full range of the sonar (depending on the target's size). At these ranges the sonar can detect the target but cannot tell the depth, because the echo from the target is corrupted by the multipath propagation. FarSounder's in-water target detection algorithms are stabilized from ping to ping. This means that less reliable targets are filtered from the screen and reliable targets are kept persistent on the screen. The software currently requires a squelch threshold level to be set. This can be done manually by the operator or automatically by the software when "auto-squelch" is set. When setting manually, we recommended that the 3D sonar display's color be set to signal level. This enables the user to see if targets are just barely detectable or really quite loud reflectors. The numeric value of the squelch level is the same scale as the colors shown when mapped to signal level.
Like a marine radio, setting a suitable squelch level will filter out most false alarms. Setting the squelch too high will also filter real signals (targets). We recommend that the squelch level be set such that an occasional false alarm is seen even though most of these false alarms will be filtered out by the stabilization algorithms.
The Chart Overlay Display
FarSounder's software includes sonar chart overlay of in-water targets on top of standard S57/S63 nautical charts. In this display, all of the in-water targets detected by the sonar (and seen in the 3D sonar display) are plotted on top of a nautical chart. This feature enables the user to better understand what is being detected by the sonar. This display greatly improves the user's situational awareness and we often regard the chart overlay as the primary display.
In order to take advantage of the insight that the chart overlay provides to the user, it is important that the display is used correctly. We recommend:
Set the in-water target squelch appropriately (in the 3D sonar display).
Adjust the window size of the chart by sliding the side bar divider and/or moving the chart display to the main window in SonaSoft.
Make sure that the zoom level of the chart allows the user to see the full range of the sonar's field-of-view.
If the user wants to zoom in on the chart to look at the details of a particular feature, be sure to zoom back out to an appropriate scale when finished.
Select "Auto-Center" from the chart's options. This ensures that the chart will pan automatically as the vessel moves. It does not, however, adjust the chart scale settings.
Most of our users have an ECDIS or other electronic charting system on the bridge right next to the FarSounder sonar display. Our chart overlay features are not intended to replace these other products. Rather, the chart data is intended to improved the user's understanding of the sonar data. We have minimal settings and options in our chart display specifically, because we want to emphasize the sonar image and its relationship to the historical chart data.
Suggested Usage and Settings
When transiting in a "known" environment and operating in a Long Range Mode, users often don't care about high quality seafloor image. In these cases, the chart may be nominally correct. It's the things not on the chart that you often care about the most. If a target is persistent on the overlay but nothing is marked on the chart, be careful. Sometimes charts are marked with only the approximate location of obstacles. In-water targets can show you where the corals actually start, where the edge of the channel is this season, and where exactly that shipwreck is laying.
The best practice to use the sonar is as follows:
Observe the whole sonar field of view in the chart display with sonar overlay. If a long range target is reliably detected (i.e seen in many pings and visually moving to the sonar while the ship is running ahead), stay alert.
If that target corresponds to some charted target (i.e. a rock, a part of the shoreline, a shipwreck) - make sure the ship route is as planned and safe.
If that target is not charted - make a decision if it potentially may be a navigation hazard.
If it looks consistent but small, the user may chose to just keep observing and wait until it comes within the system's bottom mapping range, where the sonar would be able to estimate the target depth.
If the target is big, the user should consider either maneuvering to avoid the unknown target or slow down and wait until it would come into bottom mapping range and a navigation decision can be made based on depth.

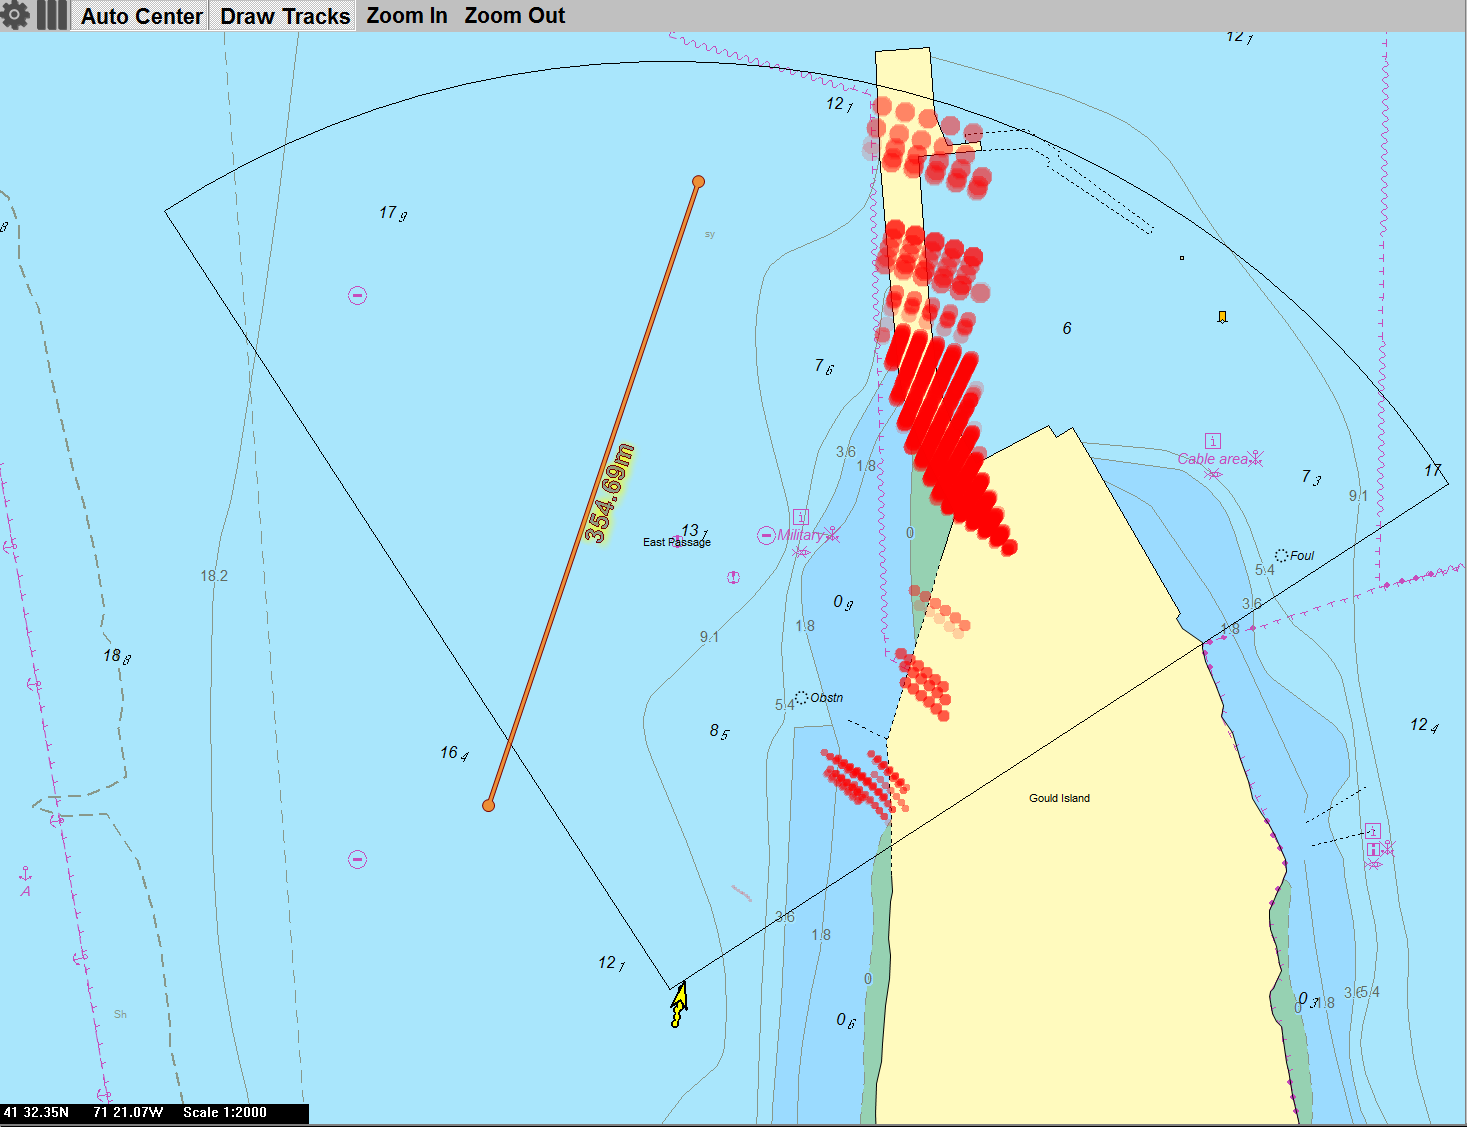
If the zoom level of chart overlay is not set correctly, the user will not see the full coverage zone of the sonar. This prevents the user from seeing these in-water targets as an overlay on top of the jetty to starboard and pier to port.

An aerial view from Google Earth clearly shows jetty and pier detected by the sonar in the previous figure.
Example of What NOT to Do
The above image shows a screenshot of the sonar's software not being set correctly. In this image, the sonar is set to 500 meters range, but the chart is zoomed in so far that the entire field of view is not visible. In this case, it would be much more difficult to understand what the sonar is detecting. The aerial view of the location in the image at right, like a properly zoomed chart display, reveals that the in water targets correspond to the jetty and pier on each side of the waterway.